
X
Click here to view all steps
Don't show me again

Steps
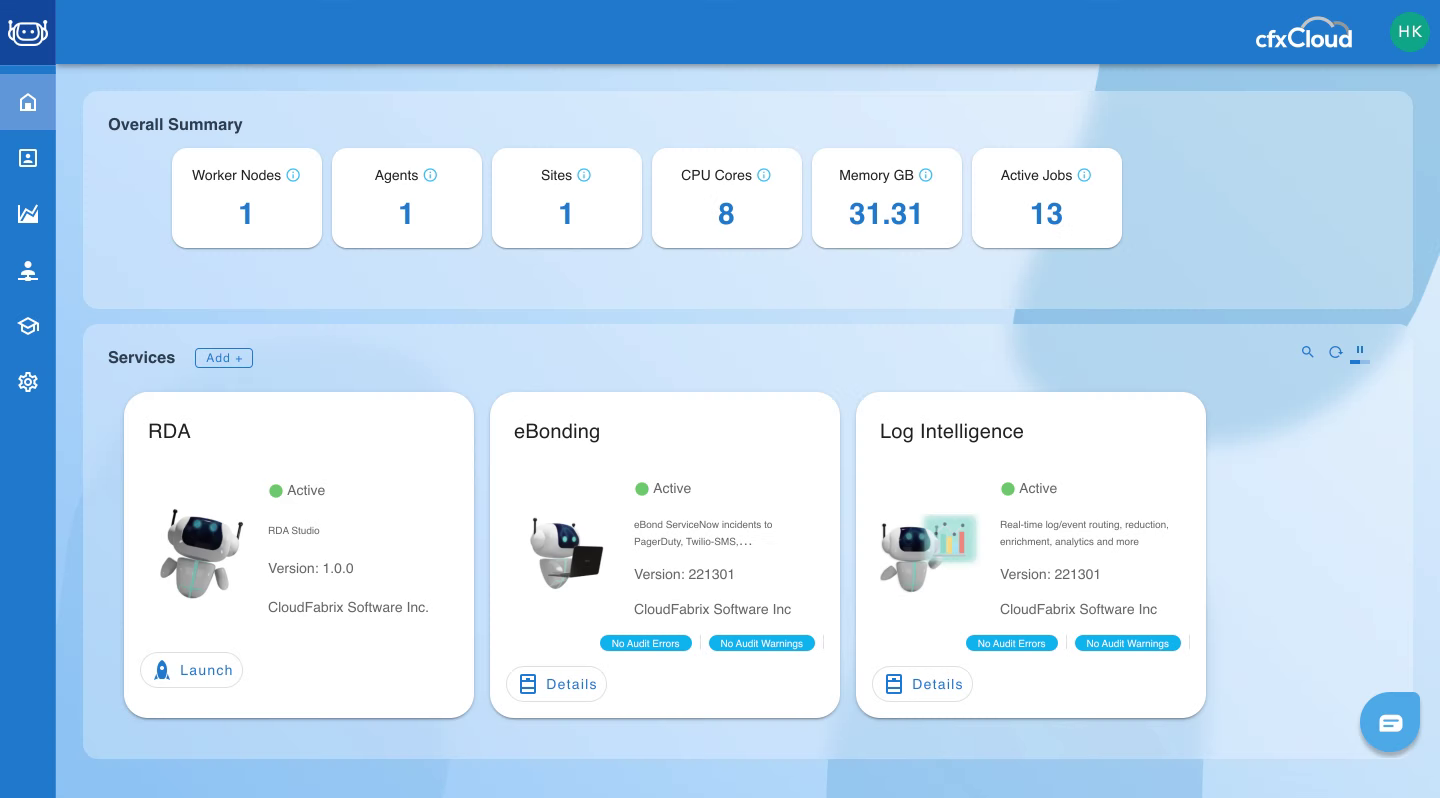
- Click on Details
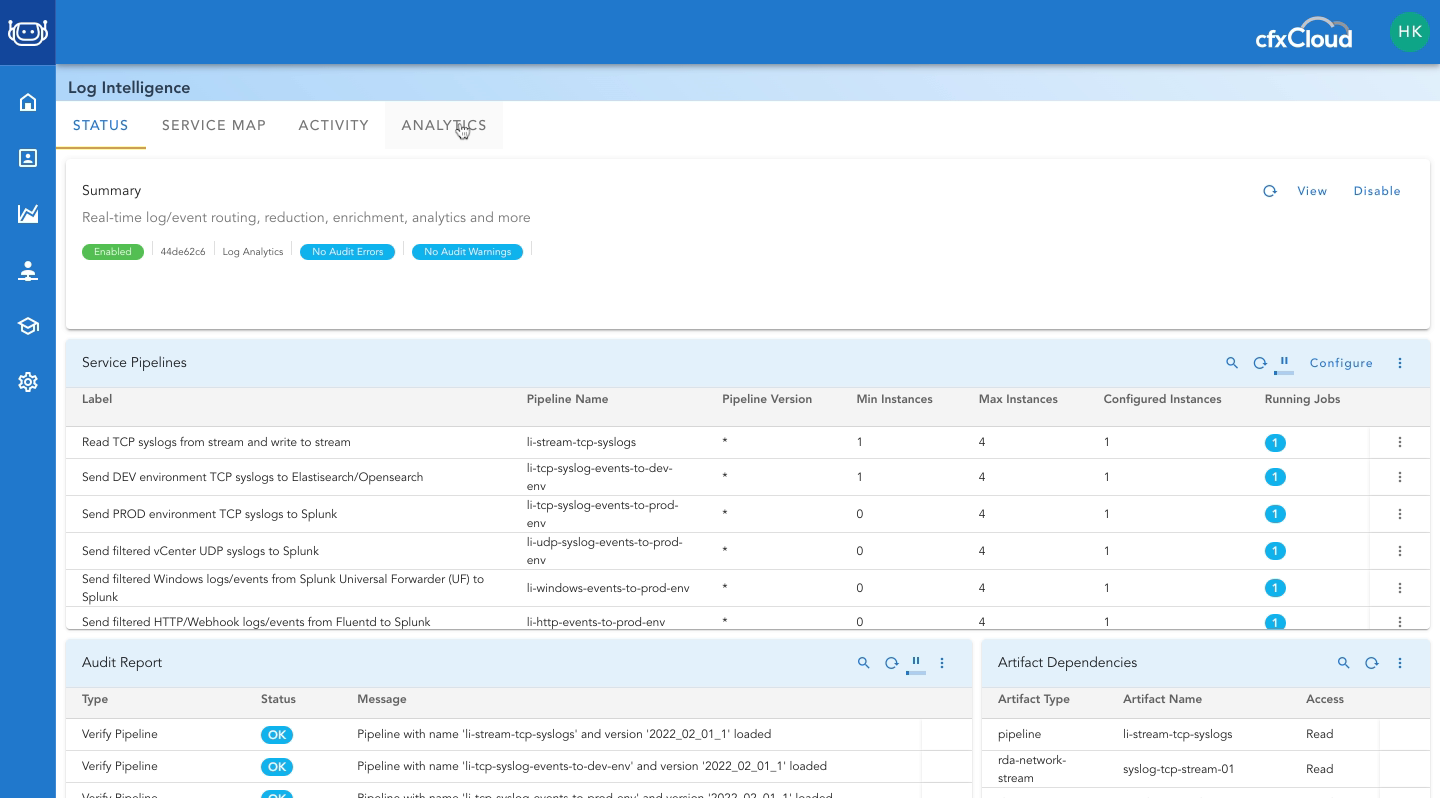
- Click on Analytics
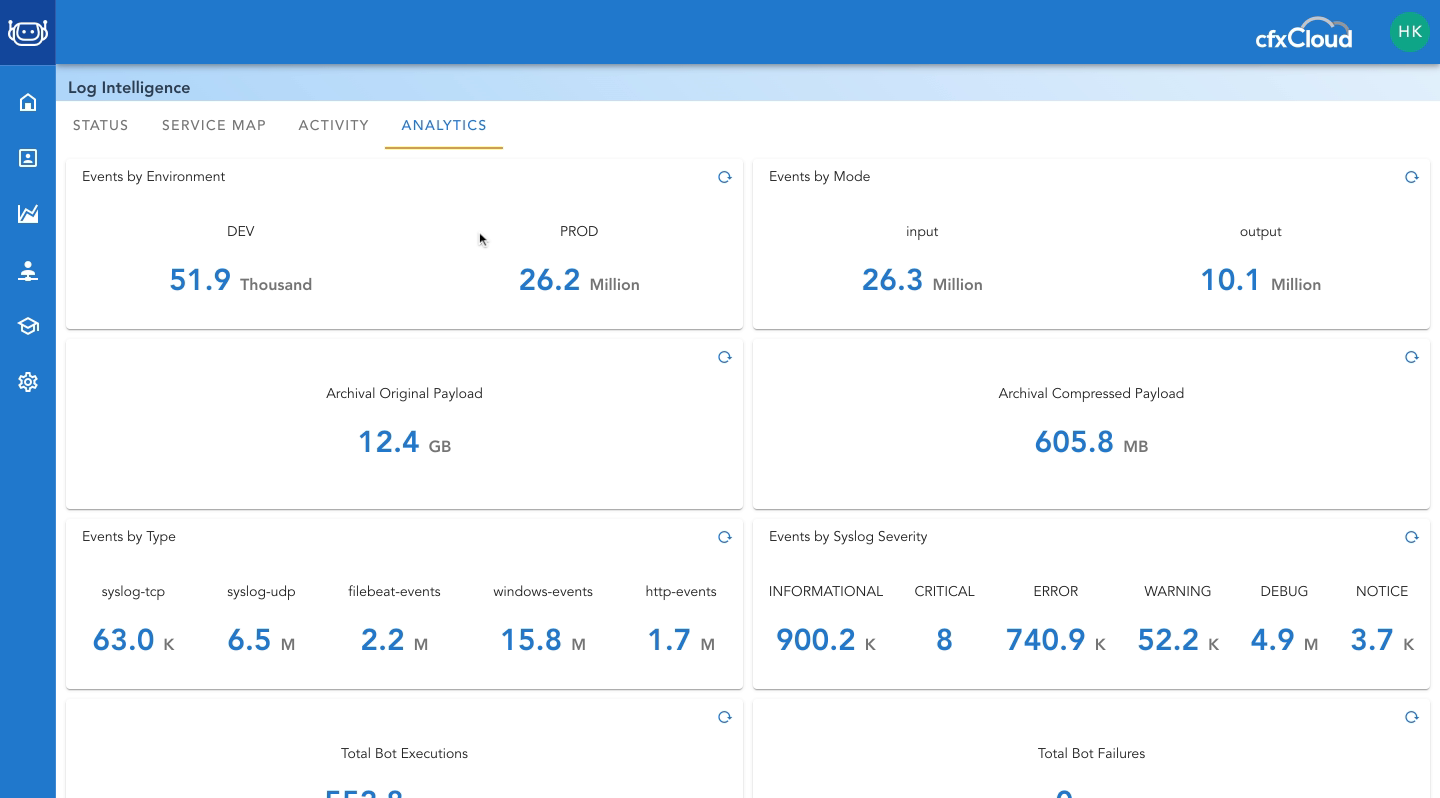
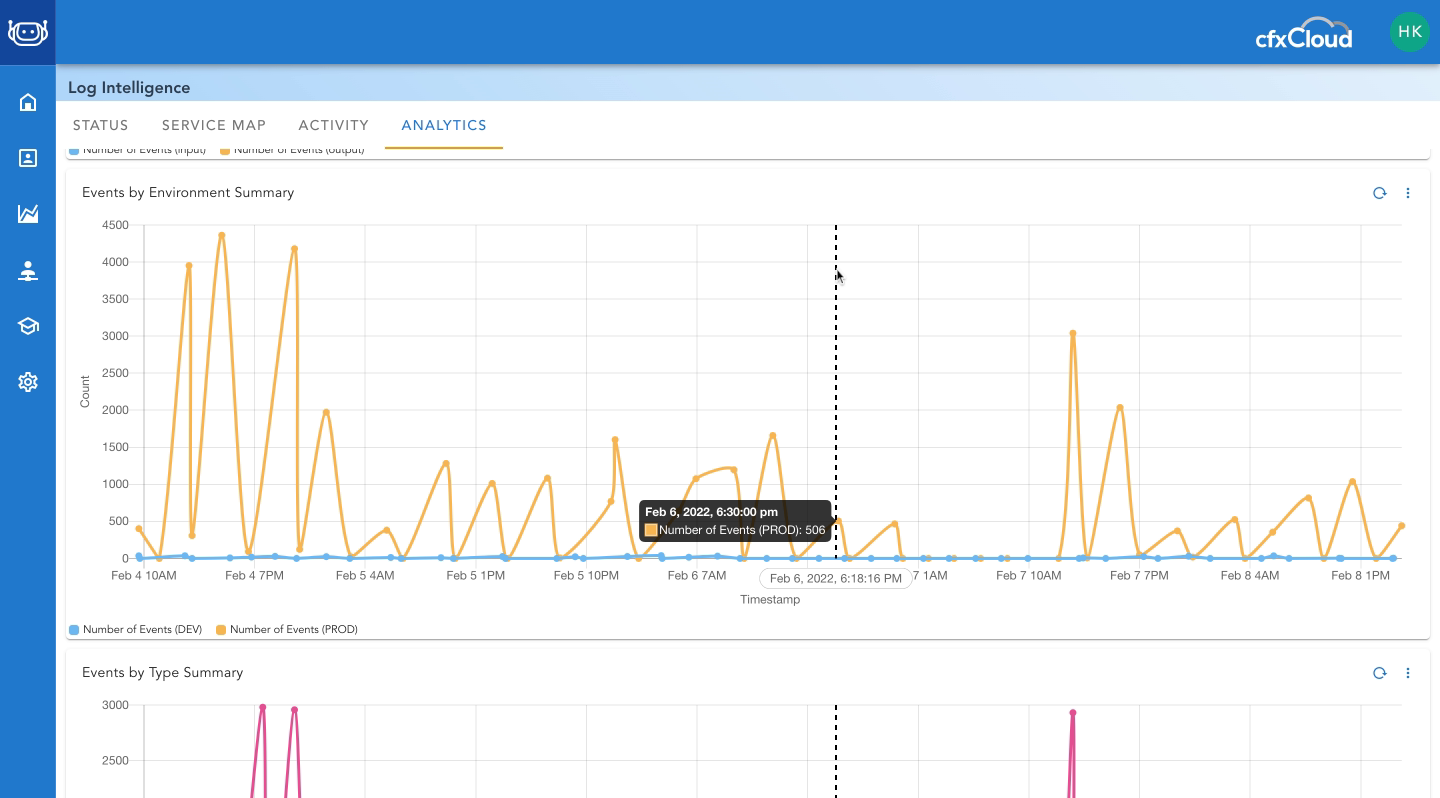
- Review Events by Environment
- Review Events by Mode
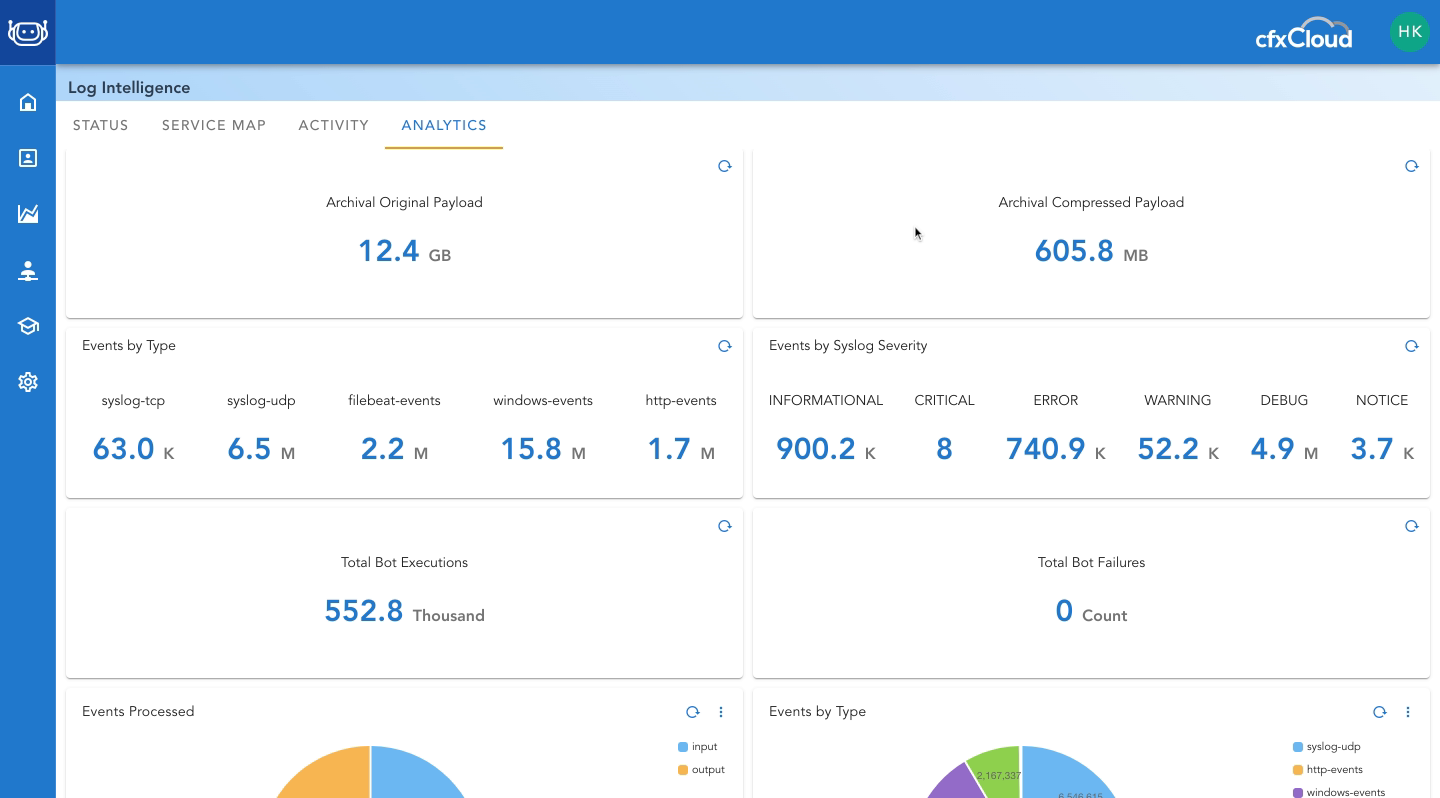
- Review Archival Original Payload
- Review Archival Compressed Payload
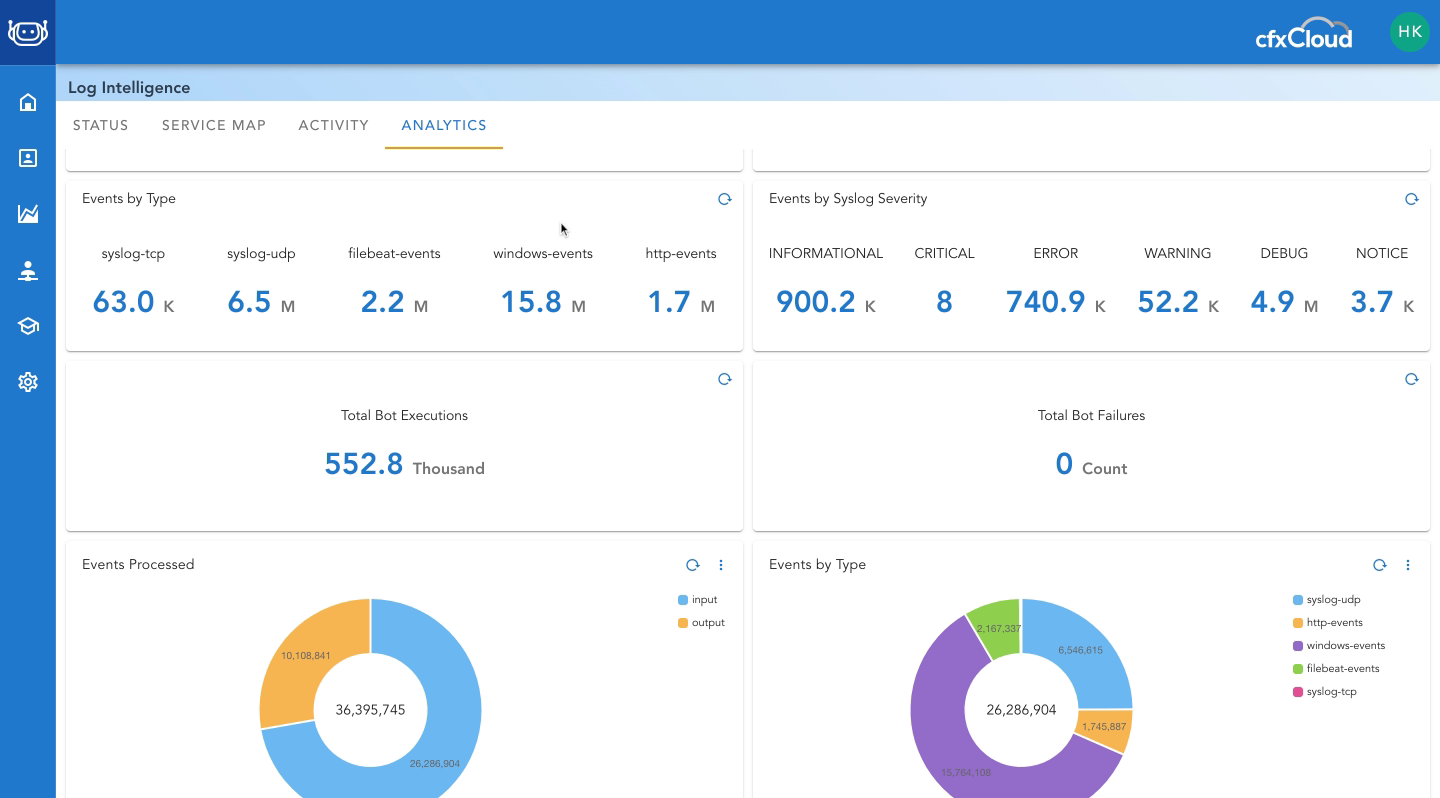
- Review Events by Type
- Review Events by Syslog Severity
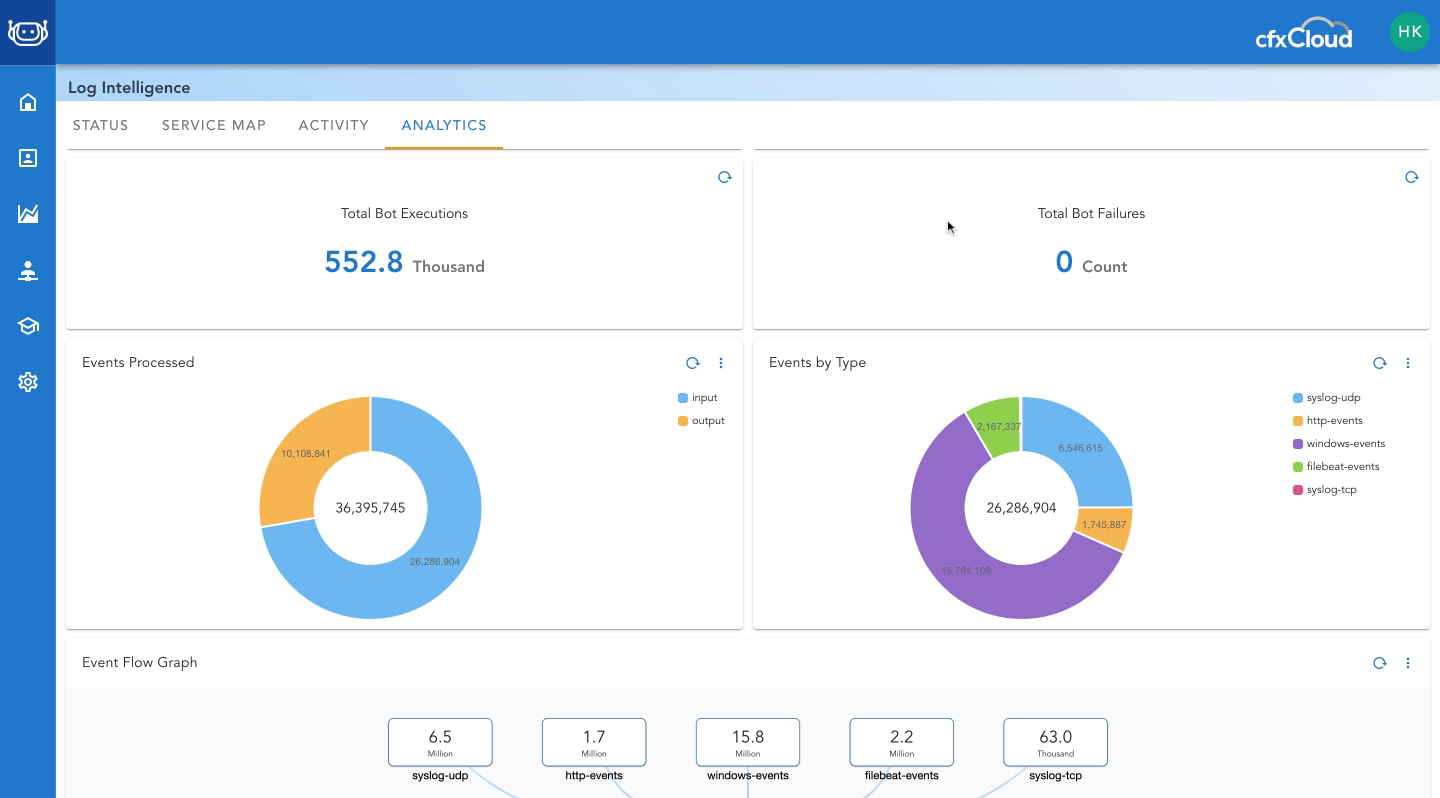
- Review Total Bot Executions
- Review Total Bot Failures
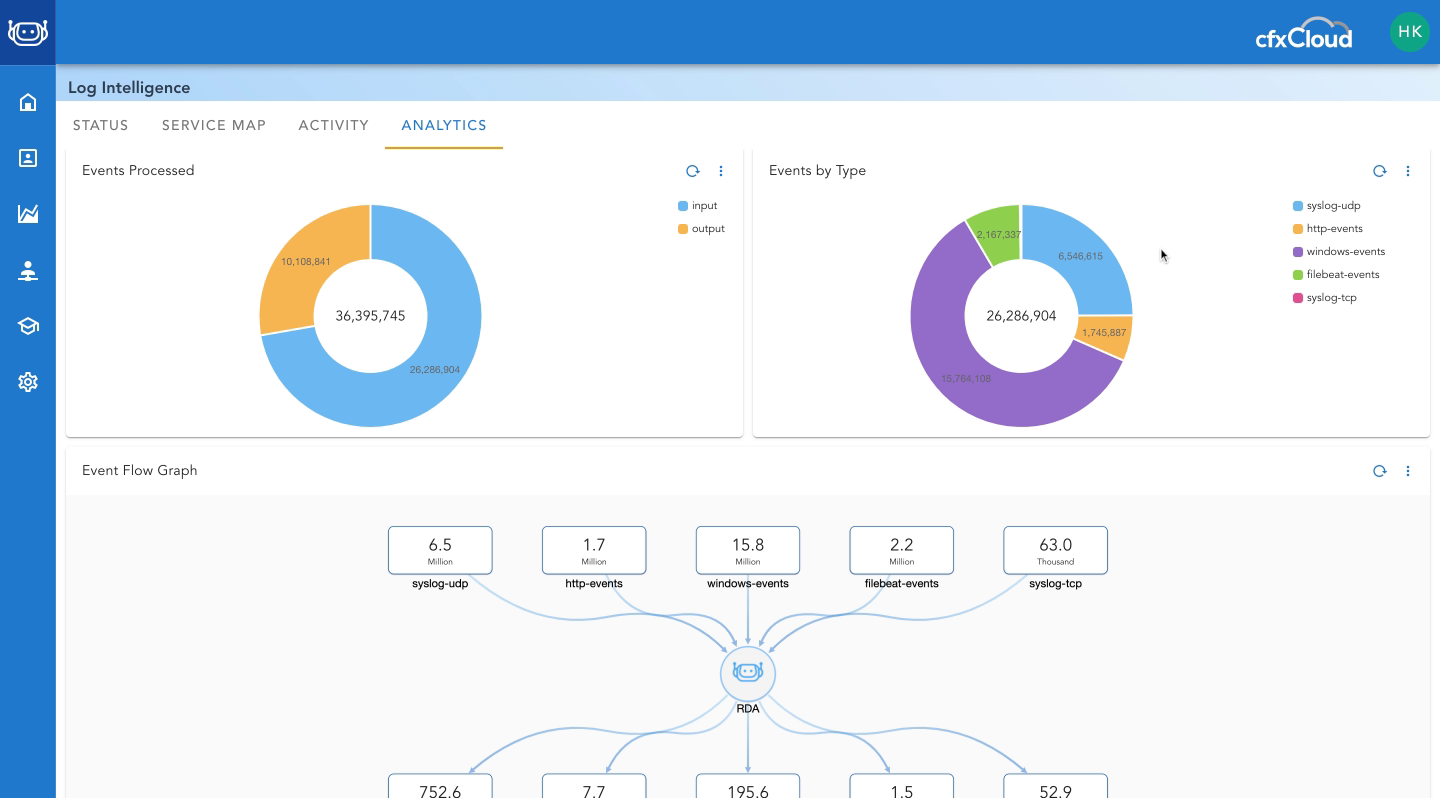
- Review Events Processed
- Review Events by Type
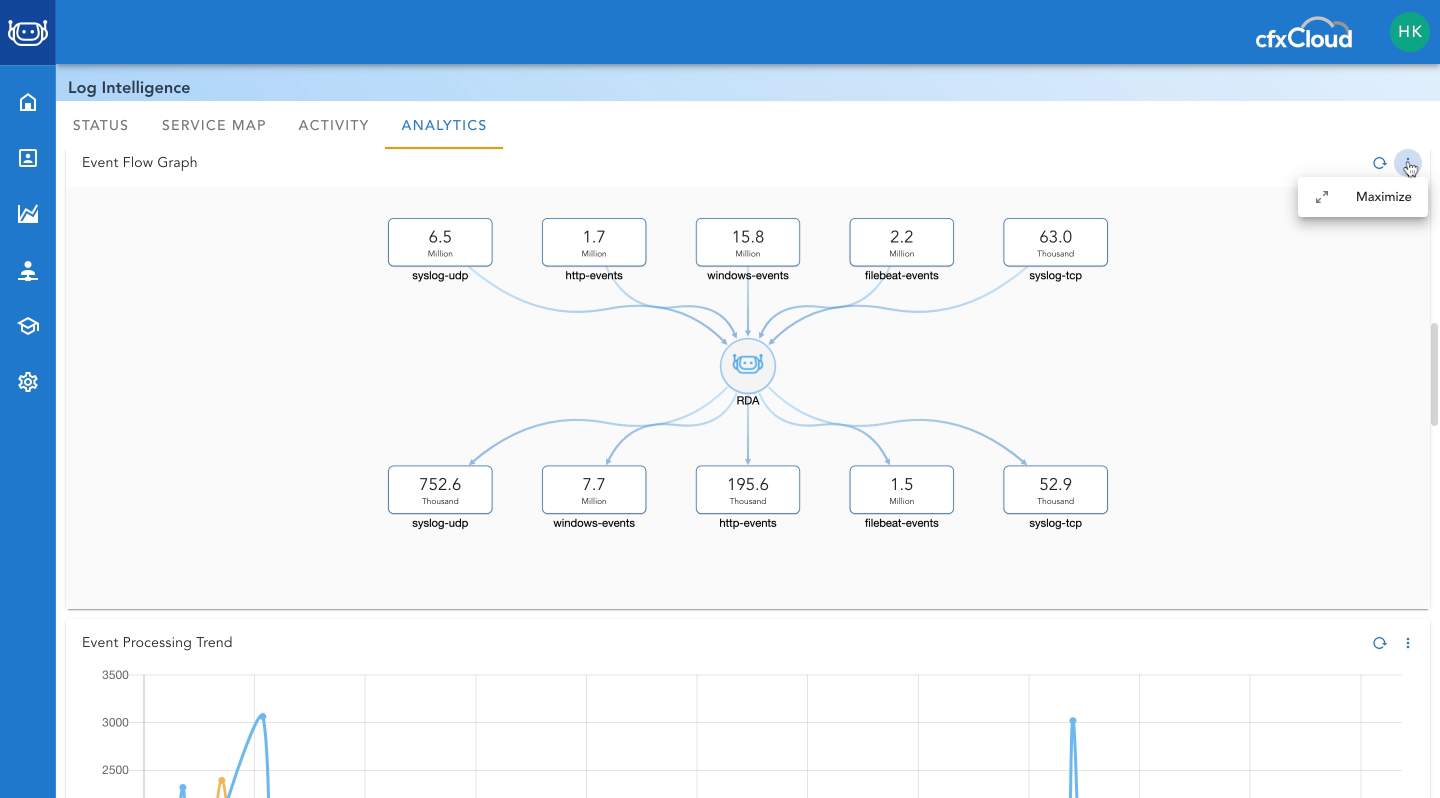
- Click on 3-button menu
- Click on Maximize
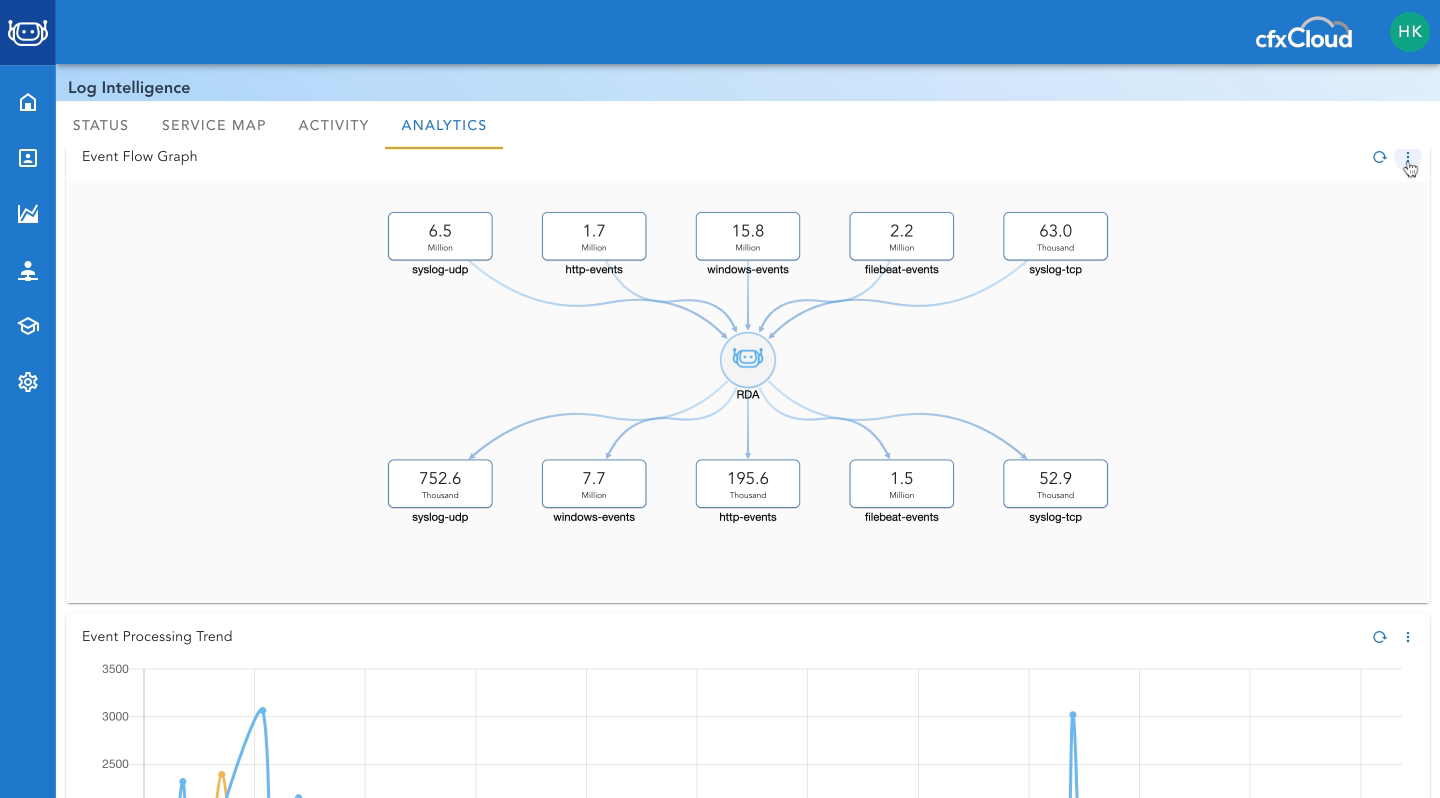
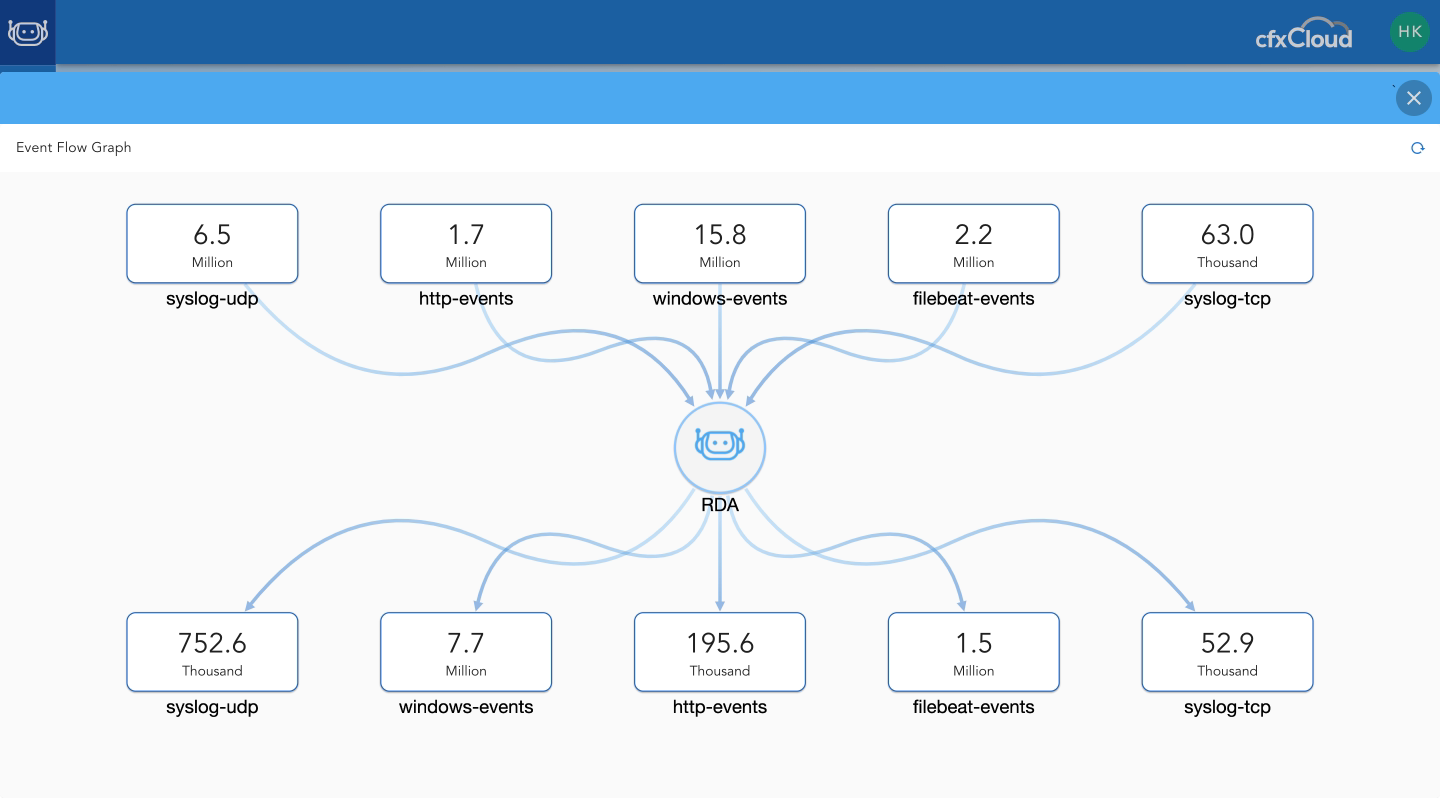
- Review Event Flow Graph
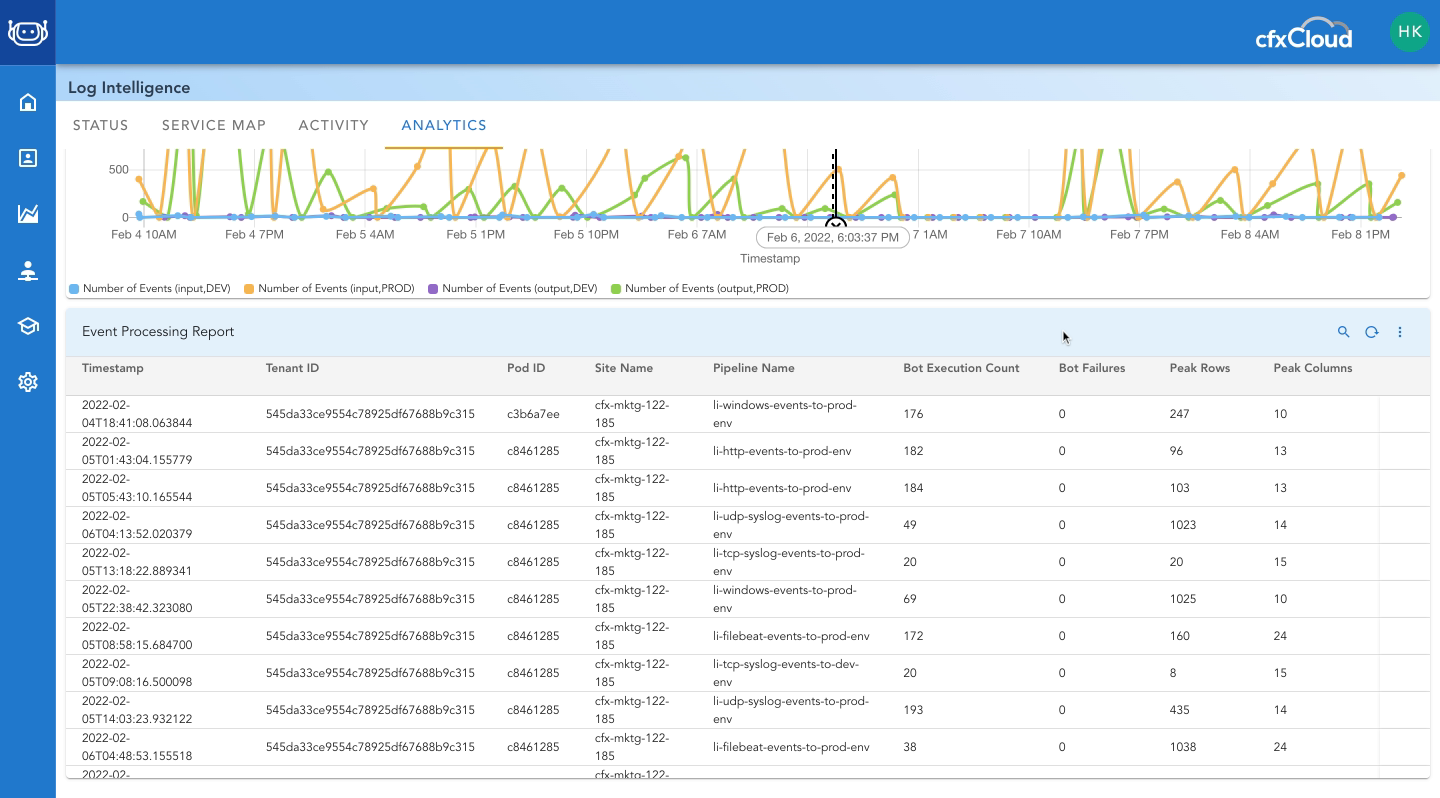
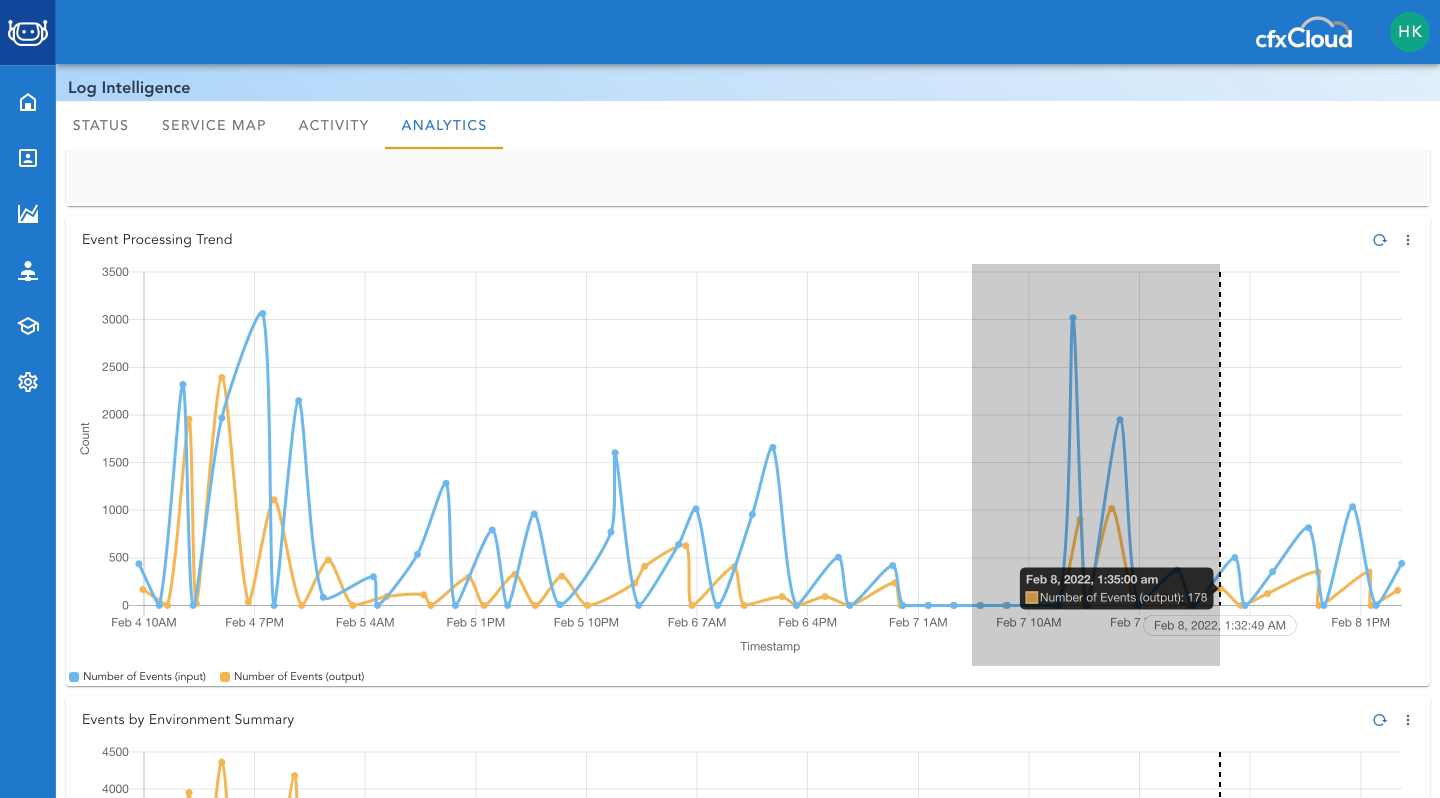
- Review Event Processing Trend
- Review Events by Environment Trend
- Click on Event Processing Report
Steps
- Click on Details
- Click on Analytics
- Review Events by Environment
- Review Events by Mode
- Review Archival Original Payload
- Review Archival Compressed Payload
- Review Events by Type
- Review Events by Syslog Severity
- Review Total Bot Executions
- Review Total Bot Failures
- Review Events Processed
- Review Events by Type
- Click on 3-button menu
- Click on Maximize
- Review Event Flow Graph
- Review Event Processing Trend
- Review Events by Environment Trend
- Click on Event Processing Report

1
Overall analytics to show performance of key components of Robotic Data Automation Fabric
2
Shows list of enabled services. New services can be activated by clicking on 'Add' button and selecting from market place catalog.
Steps
- Click on Details
- Click on Analytics
- Review Events by Environment
- Review Events by Mode
- Review Archival Original Payload
- Review Archival Compressed Payload
- Review Events by Type
- Review Events by Syslog Severity
- Review Total Bot Executions
- Review Total Bot Failures
- Review Events Processed
- Review Events by Type
- Click on 3-button menu
- Click on Maximize
- Review Event Flow Graph
- Review Event Processing Trend
- Review Events by Environment Trend
- Click on Event Processing Report